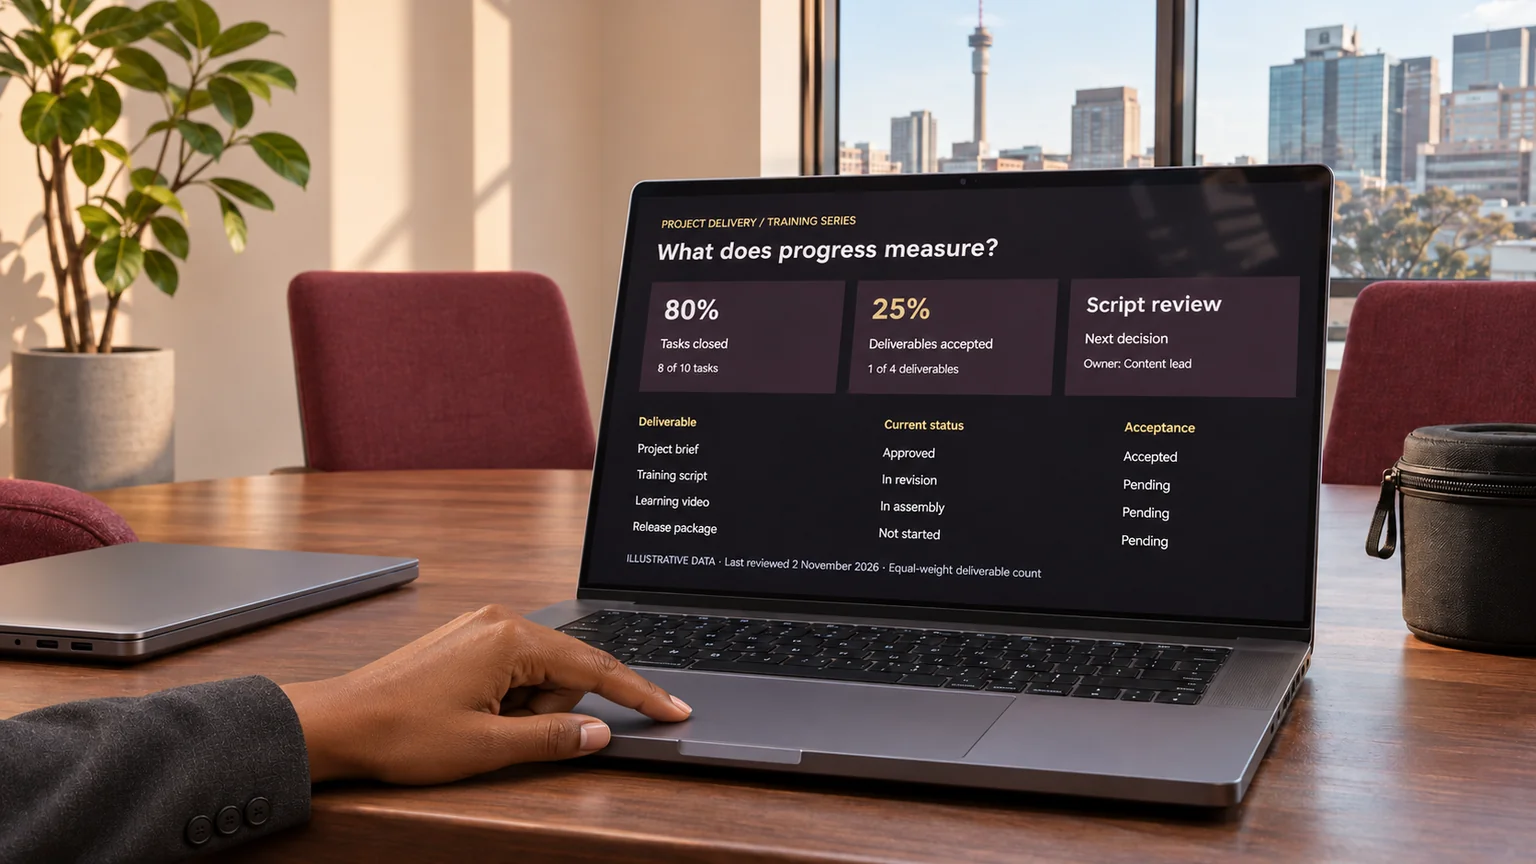
A dashboard can say that a project is 80% complete while the next useful delivery is still waiting for a decision. I would not assume that the number is wrong. I would ask what it measures, which work it excludes and what somebody is expected to do with it.
For me, a useful project dashboard is a working conversation about delivery. It should help an owner recognise a problem, understand its consequence and choose a next step. A large green percentage is only useful when the team can explain how it was calculated.
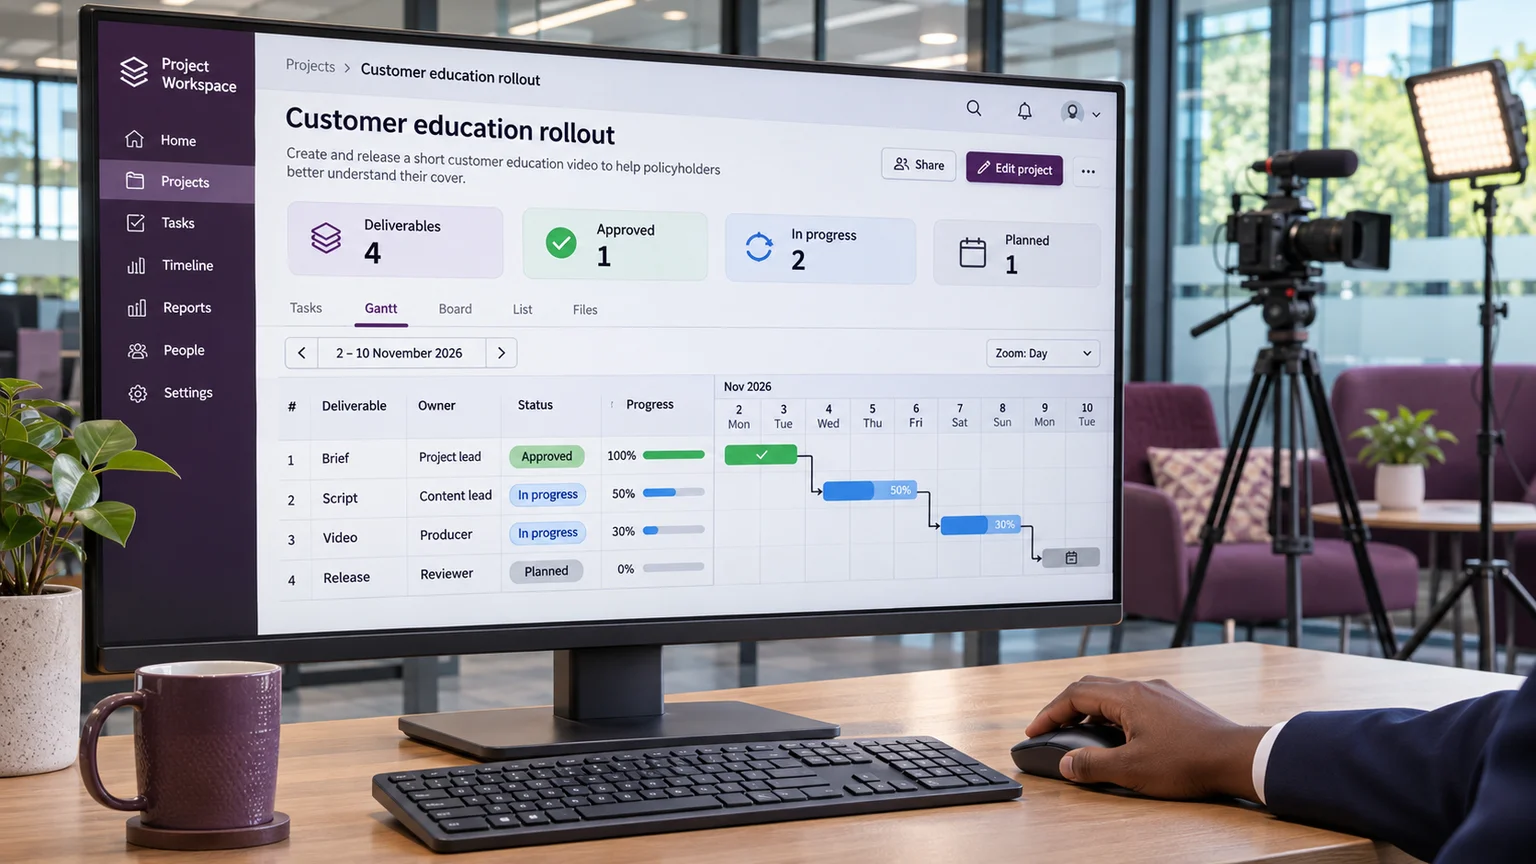
The method below is my proposed review for a fictional customer-education project. It has four deliverables: an approved brief, a script, a short video and a release package. It is a practical example, not a report about a client or a claim that one dashboard design suits every project.
I name the unit before I calculate the total
I start by asking whether the percentage describes tasks, effort, deliverables or accepted outcomes. Those units answer different questions. If eight of ten tasks are closed, the task-completion rate is 80%. That does not establish that 80% of the effort is finished, or that the customer can use 80% of the intended result.
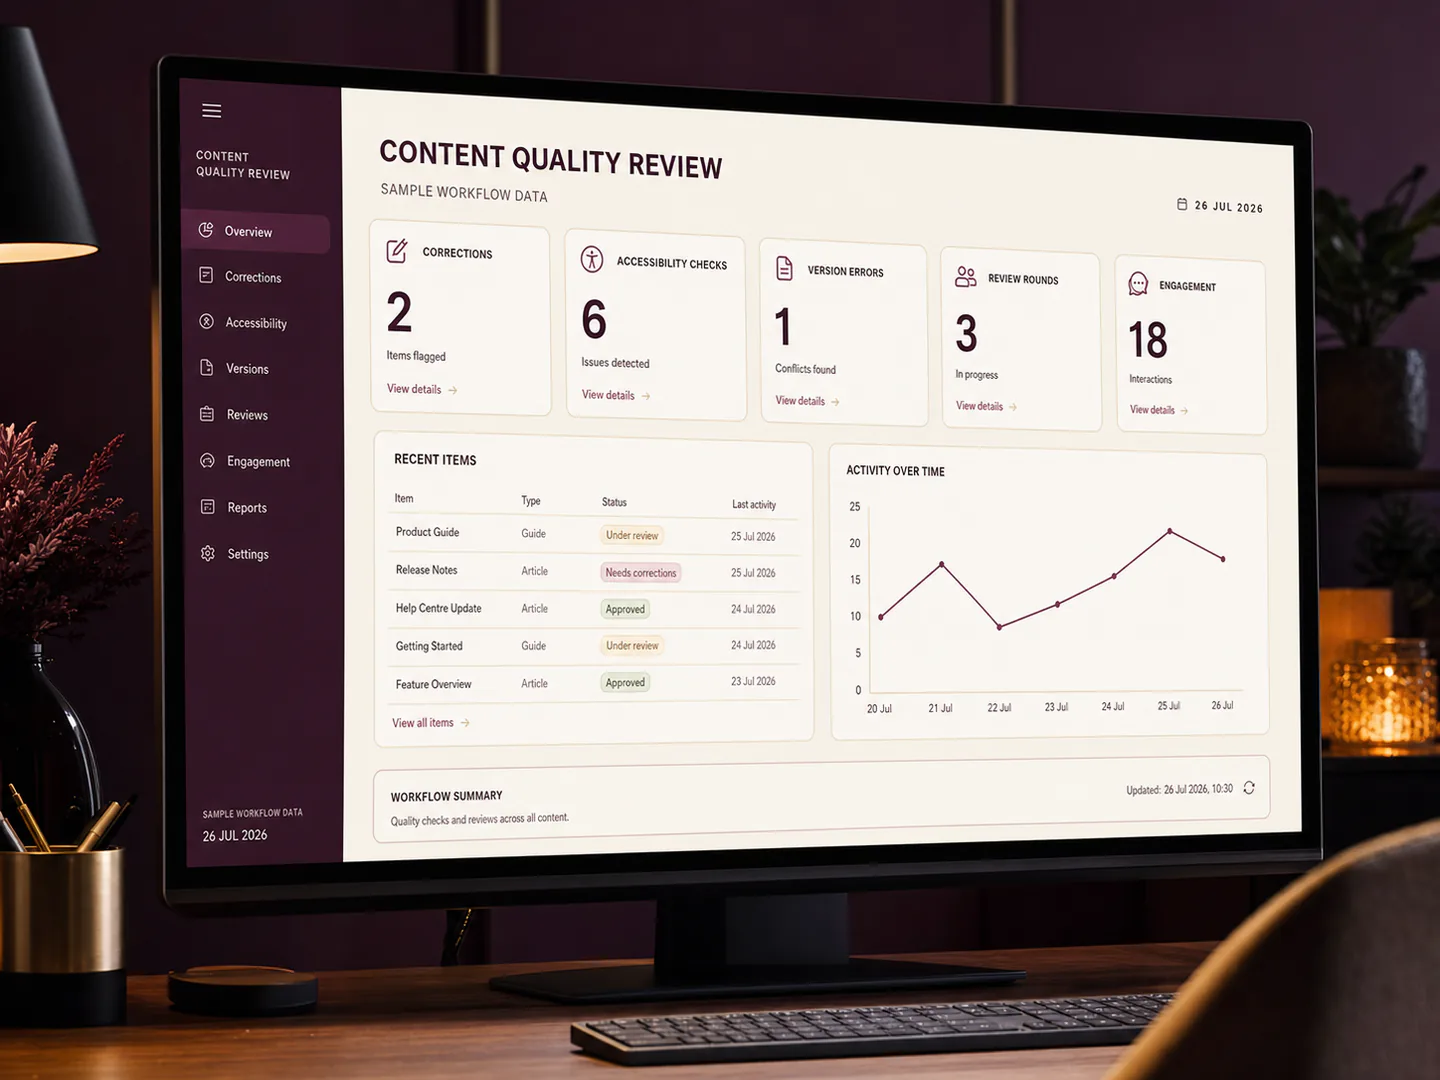
In my example, the brief is accepted, the script is being revised, the video is partly assembled and the release package has not started. An equal-weight deliverable count would show one of four accepted: 25%. I would label it exactly that. I would not rename it overall project completion merely because that sounds more impressive.
Where the work needs weighted progress, I would agree the weights before reporting and keep their basis visible. Changing the weights during a difficult week can conceal a change in the measurement rather than explain a change in the work.
I separate finished work from accepted work
An editor may have completed an export while the reviewer has not accepted its captions. Both facts matter. I would show production status and acceptance status separately, with a link to the relevant version.
For the video, the production column might say “review copy ready”. The acceptance column might say “caption corrections open”. The next-action column would name the person who must resolve those corrections and the agreed review date. This is more useful than forcing the whole deliverable into a single green or amber box.
I also want the dashboard to distinguish an intentional hold from an unexplained delay. A hold awaiting an approved source is a controlled state. A row that has not been updated for two weeks is an information problem. They should lead to different questions.
I make the denominator visible
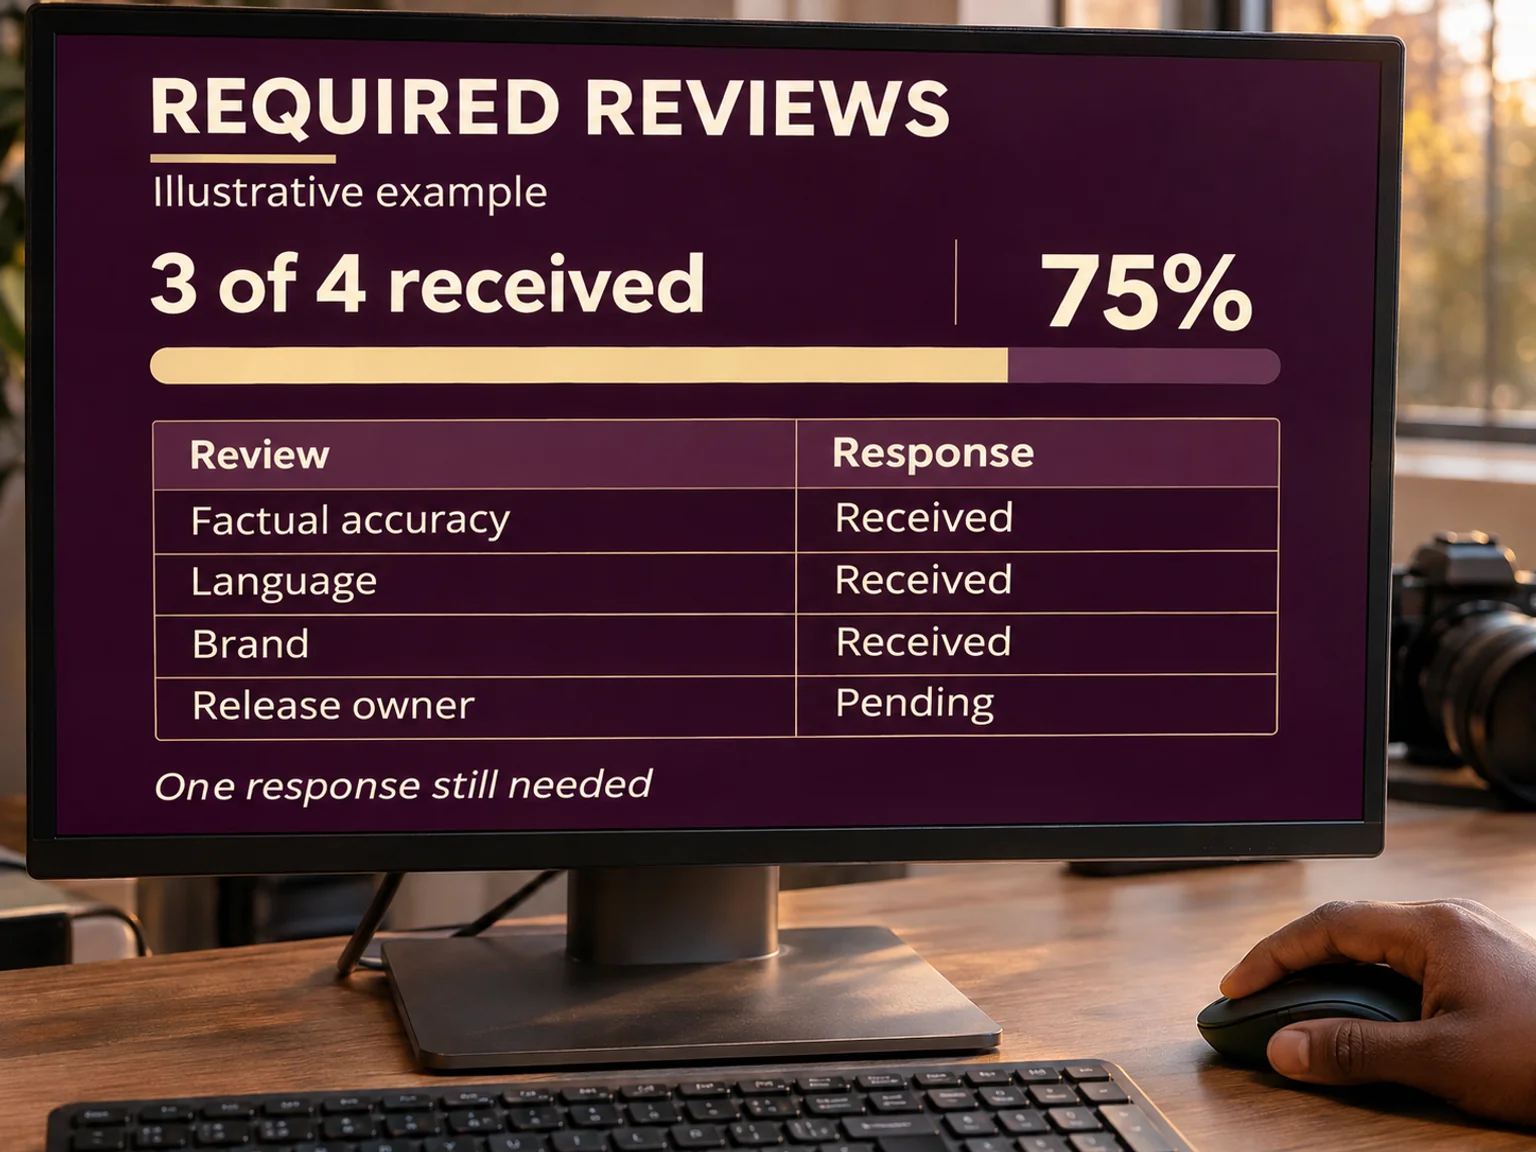
Every ratio needs a clear population. If I report that three of four reviewers have responded, I want to know which four reviewers were expected and whether each response is actually a decision. A comment saying “looks interesting” may not satisfy the agreed approval requirement.
I would place the count beside the percentage: “3 of 4 required reviews received”. If another reviewer is added, the denominator changes and the dashboard should show that change. Otherwise a falling percentage can look like lost progress when the team has actually expanded the review scope.
For small groups, I often prefer the count to the percentage. “One approval missing” makes the remaining work easier to understand than “75% approved”. It also makes the next conversation more specific.
I connect the status to its dependency
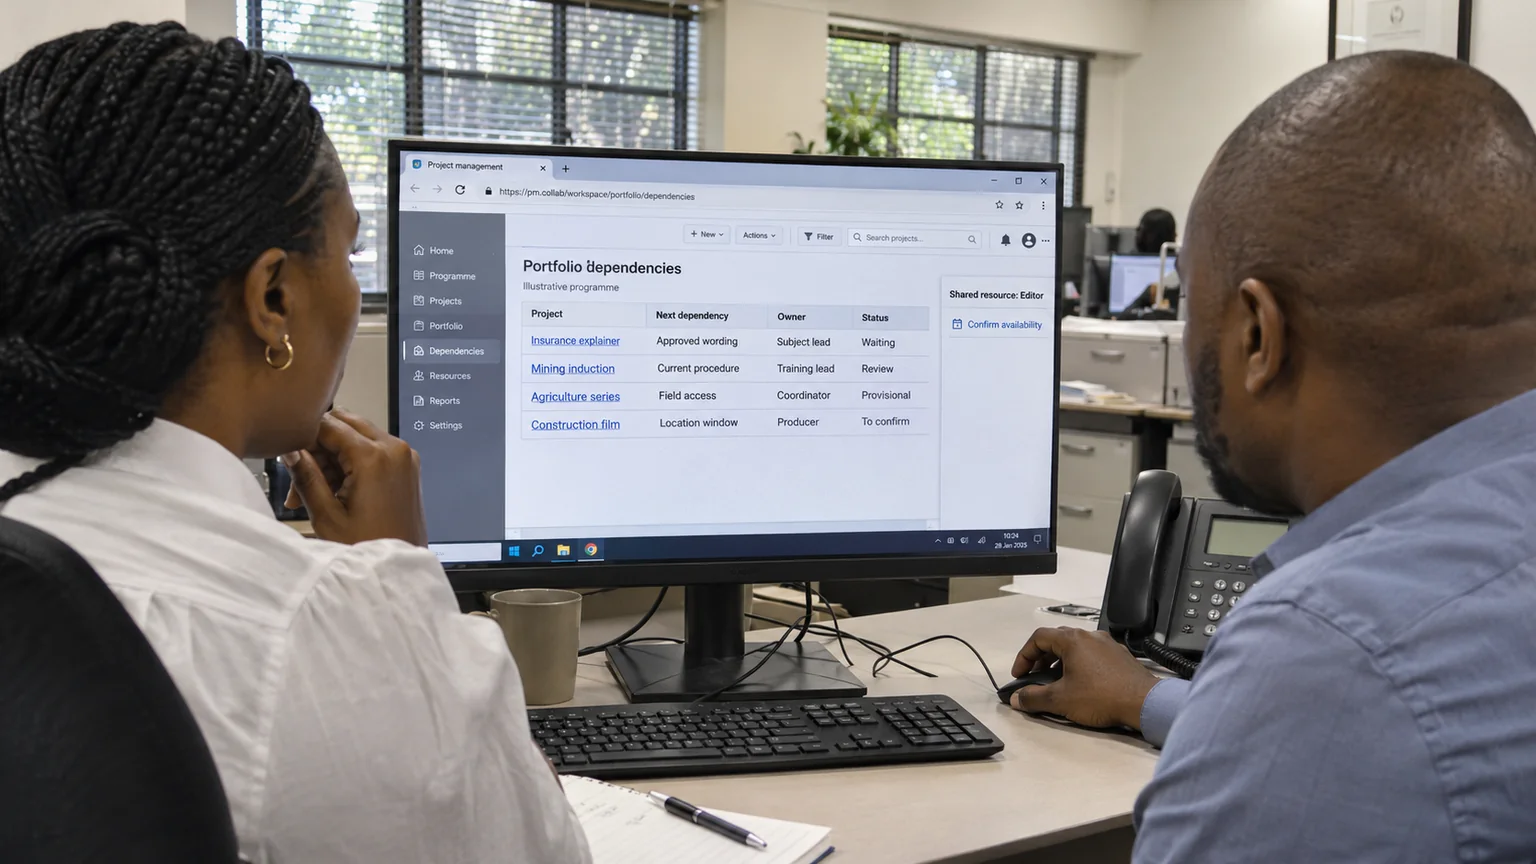
A dashboard becomes more useful when it explains what the current state prevents. The script may be waiting for a specialist to confirm one phrase. That phrase might affect only the voice-over, or it might change the entire filming sequence. I would record the consequence rather than treating both situations as the same amber status.
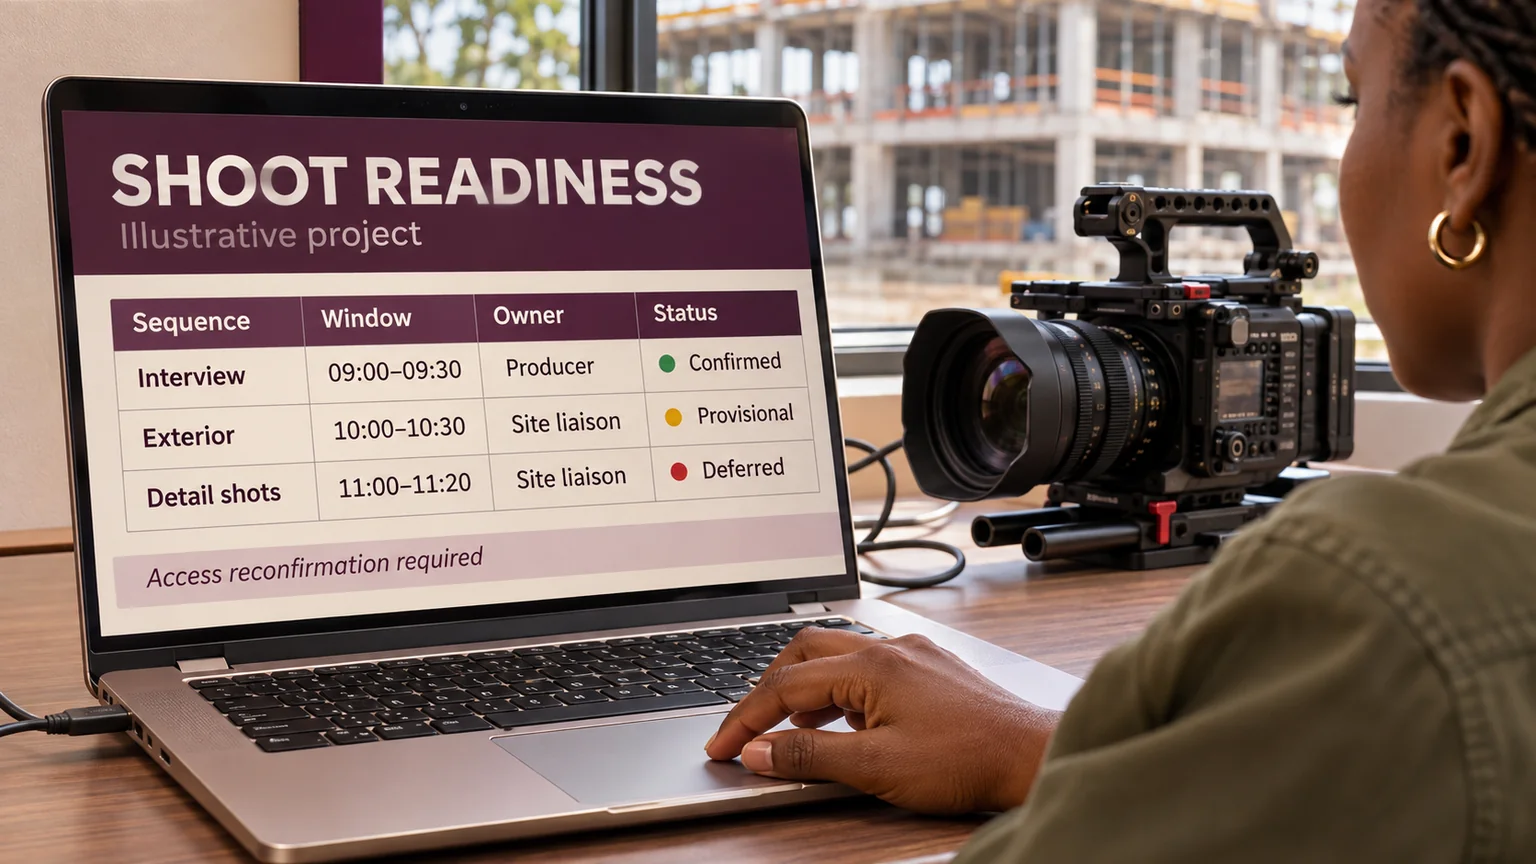
In the fictional project, I would connect the script decision to the recording booking and the edit handoff. If the decision arrives after the booking deadline, the schedule needs a real adjustment. A status colour cannot make that dependency disappear.
My preferred review question is: which decision would change the next delivery date? That keeps the conversation focused on work that can move the project, while still retaining the detail needed by individual contributors.
I show when the information was checked
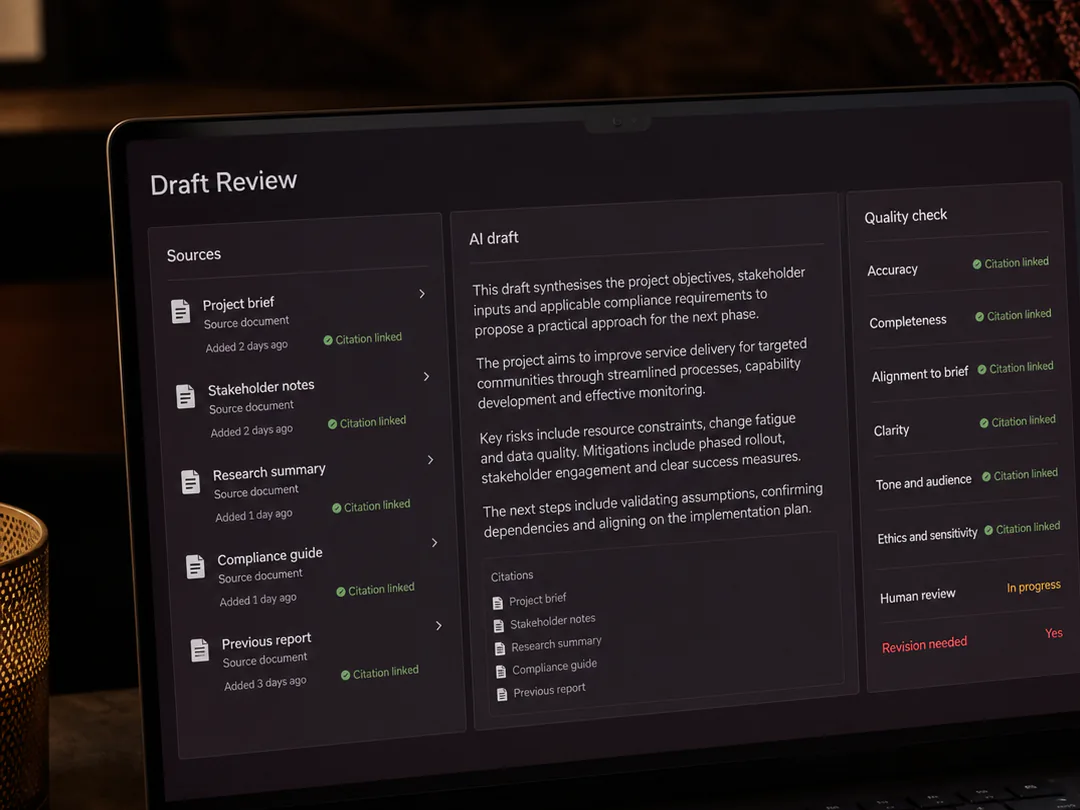
A dashboard is a view of recorded information, not a guarantee that every row is current. I would show the last meaningful update and identify the owner of each important record. An automatic refresh time is different from a human confirming that the underlying status remains true.
For example, a page can refresh at 09:00 while its supplier availability was last confirmed on Friday. I would keep both dates where the distinction affects a decision. I would also flag missing information plainly instead of filling the gap with a reassuring estimate.
This matters when AI helps prepare updates. A fluent summary can still be based on an outdated source. I would link the update back to the approved record and keep uncertain statements visible for review.
I finish with a decision, not a tour of the dashboard
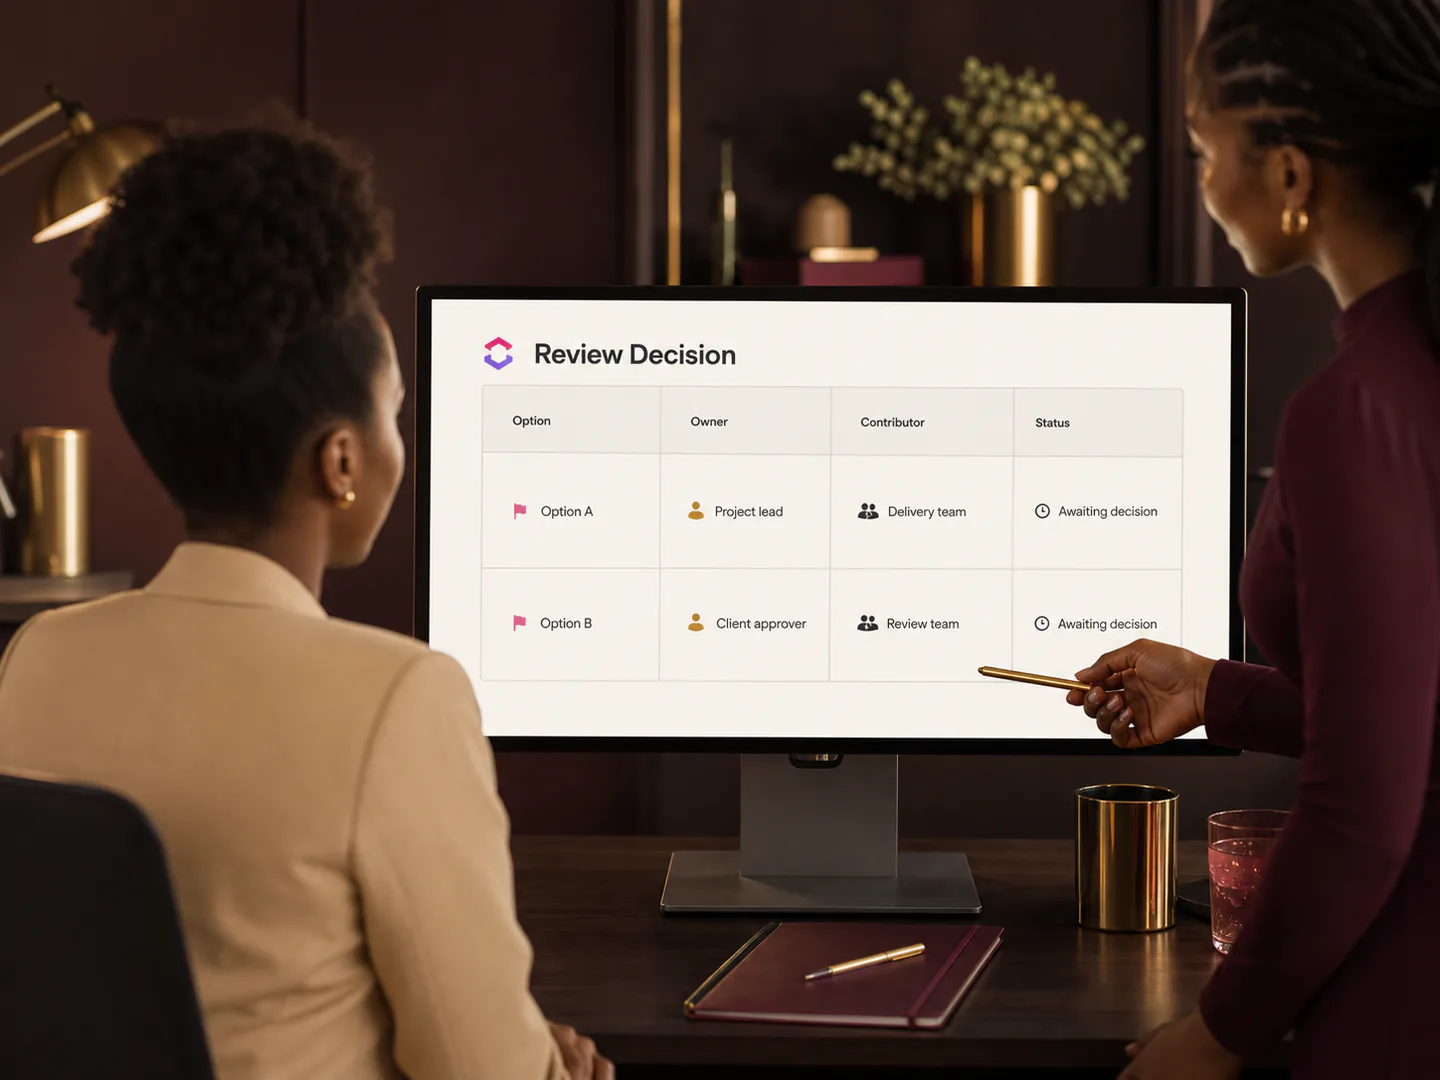
For the weekly review, I would select a short set of questions: what is accepted, what is waiting, what threatens the next commitment and who will act? The dashboard should support those questions without requiring every participant to interpret every chart.
I would leave the meeting with a named decision owner, a next step and a date for checking it. If a metric repeatedly attracts attention but never helps anybody choose an action, I would reconsider its place on the page.
The aim is a dashboard that earns trust through explanation. I want its numbers to be traceable, its uncertainty to be visible and its status labels to lead to useful work.
Source and research boundary
PMI's October 2026 announcement provides context for combining AI capability with human judgement. The dashboard method and calculations above are my own illustrative proposal. Research checked on 2 November 2026; the August date is a retrospective series label, not a claim of earlier publication.